Social collaboration correlation with the engagement rate
Businesses and service providers use social media’s ability to adapt their marketing campaigns and achieve a long-term strategic advantage. Setting quantitative and attainable expectations is critical to the success of every marketing or business endeavour.
By focusing on the data-driven effects of paid services such as Twitter Blue [1], providers can potentially reverse-engineer break-even rates, expected Return on Investment (ROI), and performance timelines. Social networking analytics and metrics can estimate the expected number of customers. Merging both aspects leads to a systematic approach of incorporating social, environmental, economic, and other values into standard decision-making processes, mainly alluding to the revenues. Thus, the new term Social Return on Investment (SROI) aims to express providers’ connection, clearly and consistently quantifying and monetising social impact. This metric enables stakeholders to measure the achievement of social impact against three primary performance indicators: appropriateness, effectiveness, and efficiency. In addition, businesses engage with another affordance of social media named collaboration:
“Social collaboration is the process through which multiple people, groups, or departments can interact with each other to achieve common goals.” [2]
The general idea of adding collaboration is to increase impact within the industry and the effectiveness of tactics and strategies. The decision-making process related to the business revenue will thus benefit from a new metric defined for the needs of the ARTICONF project called Return On Collaboration #ROC. Measuring ROC provides users with real-time cost per engagement analyses, allowing them to define their specific business application success indicators. The traditional ROI calculates the gain or loss of a given investment. On the other hand, ROC measures the sum of “improvement” resulting from a monetary expenditure in collaboration and the innovative ROC model facilitates user collaboration and revenue growth. As a result, providers can assess the effect of social media services and technologies.
Engagement metrics are the most commonly used criteria when measuring [3] the quantity of collaboration.[4] Thus, applying correct engagement and conversion strategies to leverage social commerce and convert engagement to sales helps businesses amplify revenue and ROI using digital market platforms. The engagement metrics often track user involvement with the service and effectively promote services. It indicates how the application meets user expectations after they sign up and over time. Retention depends on the value found by the customer in the service. Monitoring the level of engagement helps to determine the level of customer satisfaction and identify potential churn. [5]
Engagement rate metrics for centralised entities
“Engagement rate is a formula that measures the amount of interaction social content earns relative to reach or other audience figures.” [6]
The reactions, comments, shares, views, followers, likes, impressions are some vanity metrics alight with the specific application for engagement rate calculation. The main goal of the various engagement metrics is the selling point in the social media environment, bringing more ROI. Calculating the engagement rate is difficult in the absence of a standard metric. There exist multiple ways to measure it depending directly on the social application in use. Various applications rely on centralised entities that impose strict rules and implementing the proper engagement rate in the correct context is unique for different social applications. The next sections provide engagement rate calculation examples used by different popular centralised applications.
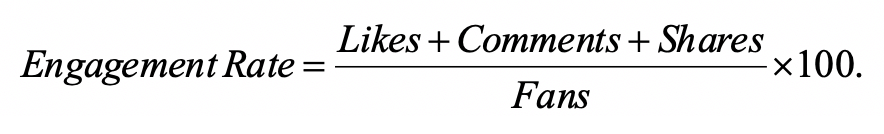
The engagement metric measures the effectiveness of the posts and their connection with the fans. Facebook calculates engagement metrics based on the number of likes, comments, shares, and clicks generated by the posts: [7]
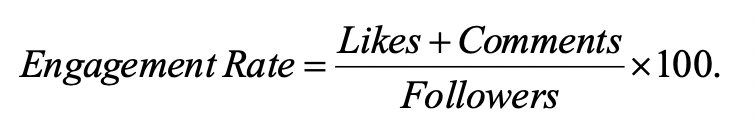
Engagement rate per post is the total number of people who saw and liked or commented on a post divided by the total number of Instagram followers: [8]
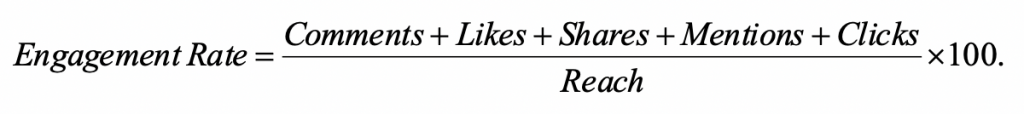
LinkedIn calculates the engagement rate by adding the number of interactions, clicks, and new followers, divided by the reach of the post. [9]
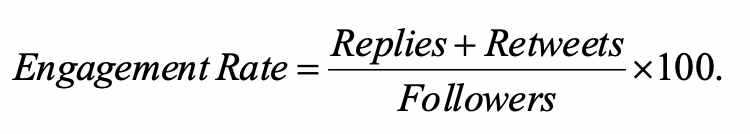
The Twitter engagement rate considers the number of replies and retweets to the total number of followers: [10]
ARTICONF extends the engagement rate metrics to function in a decentralised manner
ARTICONF, as a social media platform, is a decentralised ecosystem that allows diverse providers to create, discover, perform, and analyse various social media events involving different social media actors. More precisely, the social media ecosystem involves multiple individuals and organisations referred to as stakeholders who join the triggered events and monetise their channels by creating trusted content and engaging users. Each trigger for an event or activity happening in a social network that increases the users’ collaboration represents a potential revenue for the stakeholder. This claim introduces the new ROC metric that provides innovative quantified values representing revenues relative to each functional area’s invested capital. Hence, ROC allows providers to determine the impact of integrating social media services and the overall application performance, providing real-time tracking of engagements’ true reach and ROI.
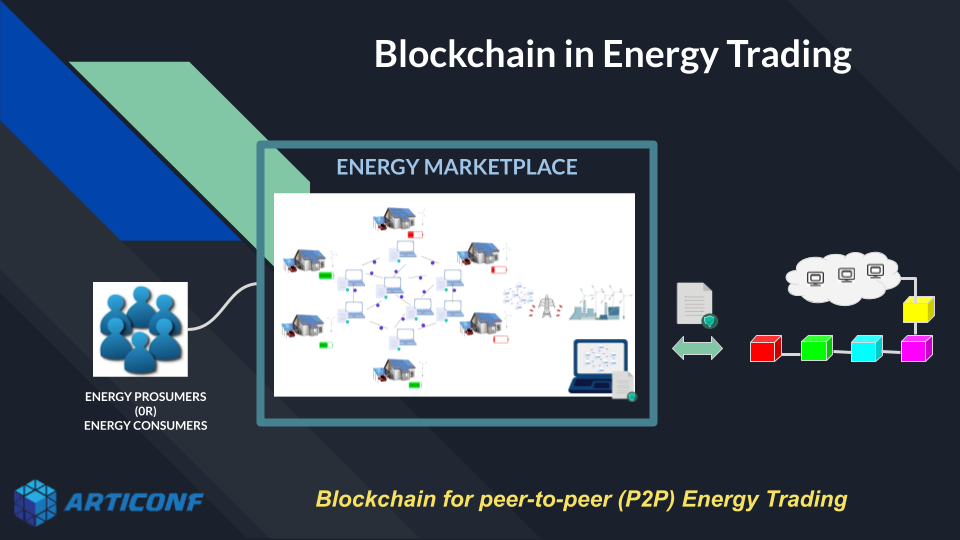
The ROC metrics qualify the users’ engagement rate when using certain application services and often tracks their promotion’s effectiveness. Following the ARTICONF platform, any voluntary user activity opens the perspective for gaining rewards as tokens for various concrete application tasks. For example, the energy marketplace use case uses application tasks for trading, sharing data, or subscribing to reward and gamification schemes. In the car-sharing use case, the owner sets the reward price if the driver leaves the car in a specific place. Using this principle of engagement rate, measurement on the dashboard provides visualisation insights for stakeholders to choose a better path for growing their business and allows the users to redeem their reward points on their monthly energy bills or other services.
The other use cases of the ARTICONF platform similarly gain and reuse rewards earned for accomplished application services. Thus, the new ROC metric needs to rely on the user savings and earnings from the accumulated dividends. The new metric must fit all applications that use the new proposed distributed platform. The following generic formula defines the overall engagement rate between the individual user rewards over the service cost itself, as an eminent part of the ROC metric whose value depends on the user’s concrete application:
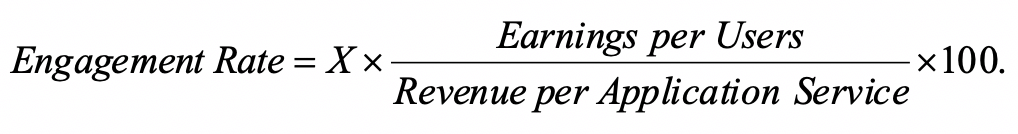
- Earnings per user metric are the reward points based on the social network platform’s user activity, representing individual user activity measurement, which increase the general profit essential from the providers’ perspective. These are usually companies engaged in incentivising businesses with social media consumers, providing various software services, and involving diverse social media actors.
- Revenue per application service metric depends on the business application’s successful functioning in the social network platform. Precisely, various application services with different prices offered to the users by the specific use-case.
- X is the number of activities performed by each user for its total earnings per application service.
Business intelligence analyses the financial indicators and tools for revenue tracking. By calculating the investment to estimate the potential profit, Tools for Analytics and Cognition (TAC) can reveal the quantitative metrics for a sharing economy. Understanding the new trends of businesses socialising on the Internet and analysing qualitative aspects of social collaboration can result in revenues that bring popularity to this technology. The newly defined ROC estimates stakeholders’ channel monetisation as a new innovative quantified value by engaging users with trusted content. TAC tool connects the new metric for engagement rate and the visualisation opportunities to make various aggregations concerning earning per user and revenue per application service metrics to perform meaningful insights about use-case social network collaboration. By incrementing the users’ collaboration, the stakeholder potentially increases the revenue through the ROC valorisation. TAC uses this principle of engagement rate measurements and provides visualisation insights for stakeholders to choose the appropriate track for boosting their business. ROC represents a significant shift and ensures that providers take advantage of the distributed social media sharing economy.
A. Karadimce, N. Paunkoska, D. Capeska Bogatinoska, N. Marina, A. Nandal. Guided Analytics Software for Smart Aggregation, Cognition, and Interactive Visualisation. Innovations in Computational Intelligence and Computer Vision, 1189:521–528, Springer, 2021. https://doi.org/10.5281/zenodo.3662582
This blog post was written by UIST team in May 2021.
< Thanks for reading. We are curious to hear from you. Get in touch with us and let us know what you think. >